
By using thermocouple sensors and plotting temperature measurements at different points in the catalyst bed, syngas plant operators can accurately predict catalyst behavior. The resulting “S” curves – along with shifts and shape changes over time – also give refineries valuable data about catalyst bed life that is essential when planning catalyst replacement.
Using robust thermocouple sensors, accurate temperature measurements at multiple points inside a reactor’s catalyst bed provide reliable data for drawing curves that help profile how the catalyst bed will perform under given conditions. These curves are also a valuable tool for estimating the life of the catalyst bed, which is important for knowing when to replace a reactor’s catalyst.
“S” Curves
“S” curves plot catalyst temperature versus bed depth and are good indicators of catalyst activity and behavior in syngas low temperature shift (LTS) reactors. These curves are even more helpful when the noise generated by temperature changes at the shift bed inlet is minimized by expressing the catalyst temperature as a percentage of the total temperature change in the reactor (% exotherm).
Monthly checkups using actual plant numbers — not monthly averages — provide sufficient data to draw useful “S” curves. For best results, plant operators should analyze these curves with experts from the catalyst supplier to determine if catalyst performance is within expected parameters.
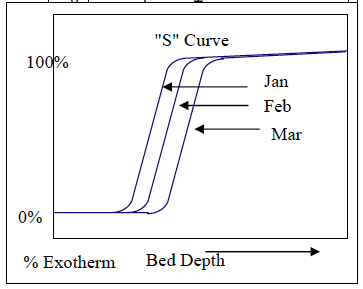
Plotting “S” curves monthly shows a consistent right-shifting pattern.
Graph Shifting
As the catalyst near the inlet of the bed deactivates, less and less exotherm is generated, and the reaction moves deeper into the bed and into fresher catalyst. Plotting several “S” curves over regular time intervals (monthly, in this figure) will show a consistent right-shifting pattern that represents these changes. If conditions remain relatively stable, the curves will maintain the same shape and the shift interval until the minimum reaction bed depth is reached.
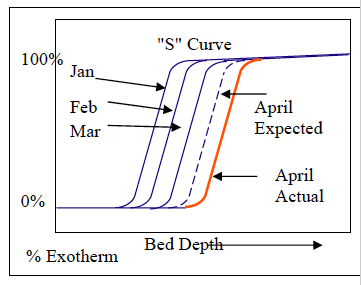
A larger-than-expected shift indicates more deactivated catalyst than normal.
A curve shift larger than expected (April Actual curve vs. April Expected curve in this figure) points to the deactivation of more catalyst than normal and at an event in the catalyst bed history that affects the life and performance of the catalyst bed. This extra deactivation may be caused by contaminants entering the process or a plant rate change, for example.
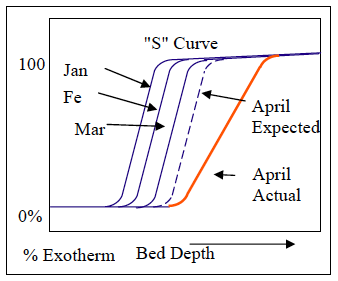
A flattened “S” curve indicates a change in catalyst condition.
Shape Changing
A change in the shape of the “S” curve is another indicator of a change in catalyst conditions. A shifted and flattened curve (April Actual) – when compared to what is expected curve (April Expected) indicates that more of the bed has been deactivated and that the reaction needs to reach deeper into the bed to maintain the same reaction rate.
This alteration may be due to either a change in the reaction rate or a change in the composition inside the reactor. It may also indicate an ongoing change in conditions and not a one-time event. In any of these cases, the plant operator should contact the catalyst supplier to review current catalyst conditions and to make adjustments.
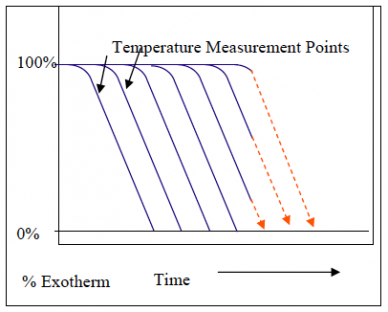
As catalyst deactivates, it generates less heat, represented by the % exotherm.
Die-Off Rates
“S” curve graphs show all temperature measurement points at one particular time. Plotting each temperature point over time will show the changes in the activity of a particular zone of the catalyst bed over time. As the catalyst above a thermocouple sensor deactivates, it generates less heat – and the % exotherm of that point decreases. When the exotherm reaches 0%, the catalyst at that particular inlet temperature is no longer active, as shown in this figure.
Since the temperature point is at a known depth inside the bed, the volume of the catalyst associated with its exotherm can be calculated. The time online needed for that point to reach 0% exotherm is also known; therefore, the die-off rate of the catalyst can be calculated.
Die-off rates are important when estimating the remaining life of the catalyst bed. The minimum reaction depth taken from the “S” curve gives the volume of catalyst required to maintain the CO slip. When the temperature measurement point at this height reaches 0% exotherm, the CO slip begins to increase. How big the CO slip can be will determine when to change the catalyst. By trending the temperature measuring point, it is easy to estimate the date of when the exotherm will reach 0%.
Die-off rate calculations also help to determine whether current operating conditions will result in the catalyst life needed. If the estimated life is too short, an increase in the inlet temperature of the bed will bring about more activity. Higher temperatures, however, may cause higher rates of deactivation. Changes in operating conditions should be carried out in consultation with the catalyst supplier to ensure best results.
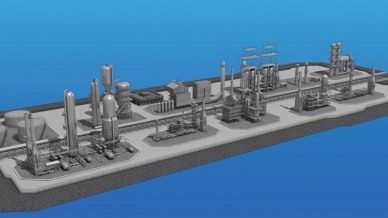
WIKA USA has developed accurate and reliable temperature measurement systems, including single sheath multipoints and flexible, independent thermocouple assemblies (Gayesco Flex-R®) that can help syngas plants predict catalyst events and die-off. For more information about thermocouple sensors, contact WIKA’s experts today.
Click here to enter our interactive refinery to learn more about WIKA product applications.